
The Creator’s Note & Disclaimer: As a 3D artist at WhatIfBody3D, I rendered this scenario at 120 FPS. Our models explore white bread versus whole wheat bread body effects — visualizing the molecular differences in starch structure, fiber fermentation mechanics, differential glycemic responses, and the gut microbiome impact of these two foods made from the same raw ingredient. This visualization is part of our “What If” series and is for educational and informational purposes only, as stated in our About Page.
Quick Answer: White Bread vs Whole Wheat Bread — What Is the Difference? (The Atomic Answer)
White bread and whole wheat bread are made from the same plant — but the way that plant is processed before baking produces foods with dramatically different effects on your blood sugar, gut, immune system, and long-term health.
- The Glycemic Difference: White bread has a glycemic index of 70–75. Whole wheat bread has a GI of 51–69 depending on processing. This difference shown translating to a measurably smaller and slower blood glucose rise — and a smaller insulin response.
- The Fiber Difference: White bread contains approximately 0.6g of fiber per slice. Whole wheat bread contains approximately 1.9g — over three times more. This difference shown producing significant effects on satiety, gut microbiome diversity, and bowel transit time.
- The Micronutrient Difference: Whole wheat bread shown retaining the bran and germ — providing significantly more magnesium, zinc, vitamin E, B6, and phytonutrients. White bread provides fortification-restored iron and B vitamins but misses most other nutrients.
- The Microbiome Difference: The arabinoxylan fiber in whole wheat shown specifically feeding Bifidobacterium and Lactobacillus — the most beneficial gut bacteria. White bread shown providing minimal prebiotic substrate, leaving these bacteria without adequate food.
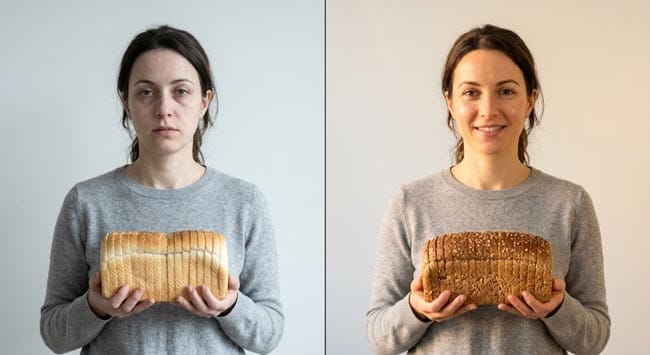
My 3D Discovery: Rendering the “Two Paths” After One Bite
When I was building the comparative digestion model for this simulation, I rendered identical amounts of white and whole wheat bread being processed simultaneously — tracking what happens to each in the same person’s digestive system.
The most visually striking contrast was in the small intestinal absorption phase. White bread starch shown being rapidly accessible to amylase — the finely processed endosperm shown releasing glucose quickly into the bloodstream. Whole wheat starch shown being partially encased in the bran fiber matrix — amylase shown having to penetrate the fiber network before accessing the starch, producing a slower, more controlled glucose release.
3D Observation: The most medically significant visualization in this simulation is the insulin response comparison. I showed the blood glucose curve for equivalent amounts of white bread and whole wheat bread — the white bread shown producing a tall, sharp glucose spike with a correspondingly large insulin surge. The whole wheat shown producing a lower, broader curve — the same total glucose eventually appearing but spread over twice as long. The insulin response shown proportionally smaller and more sustained. Over a lifetime of daily bread consumption, this difference shown compounding into dramatically different metabolic outcomes.
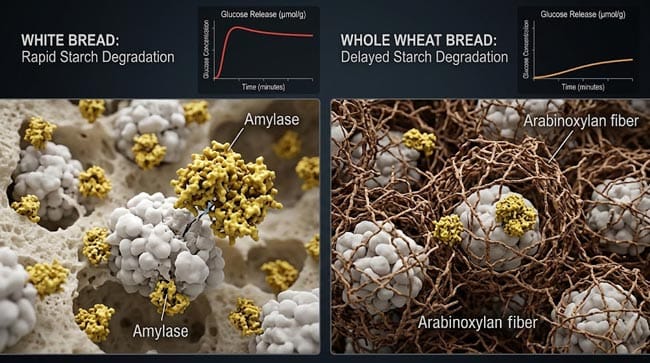
Stage 1: The Molecular Differences — Why They Behave Differently in Your Body
The Starch Accessibility Difference:
Both white and whole wheat bread contain primarily starch — but the starch’s accessibility to digestive enzymes differs dramatically between the two.
White bread starch: Shown as finely milled endosperm with the bran barrier completely removed — amylase enzymes shown making immediate contact with starch granules throughout the bread matrix. Starch shown gelatinized during baking — shown as the crystalline structure disrupted, making glucose units maximally accessible to enzyme attack.
Whole wheat starch: Shown as the same endosperm starch — but surrounded by the bran matrix of insoluble arabinoxylan fiber. Amylase shown having to penetrate this fiber barrier before accessing starch — shown as the enzyme access rate shown significantly slower. Additionally, some starch shown remaining more resistant to digestion due to reduced processing.
The Fiber Matrix Effect:
In our 3D fiber matrix model, I rendered the arabinoxylan fiber found in wheat bran:
Arabinoxylan — shown as complex polysaccharide chains of arabinose and xylose units — the dominant fiber type in wheat bran. This fiber shown:
- Physically surrounding starch granules — shown as a fiber cage that slows enzyme access
- Forming a viscous gel in the small intestine — shown as slowing glucose absorption by increasing luminal viscosity
- Being fermented in the colon — shown as a primary prebiotic for Bifidobacterium species
- Producing arabinoxylan oligosaccharides — shown as highly selective prebiotic compounds that specifically feed beneficial bacteria
The Protein Difference:
Both breads contain gluten proteins — but whole wheat shown retaining additional protein compounds from the germ:
- Wheat germ agglutinin — a lectin with complex effects on intestinal epithelium
- Albumins and globulins from the germ — additional protein fractions with biological activity
- Lipid-binding proteins from the bran — contributing to fat metabolism
The Phytonutrient Difference:
In our molecular phytonutrient model, I showed the compounds present in whole wheat but absent from white bread:
| Phytonutrient | Location in Grain | Biological Activity | White Bread |
|---|---|---|---|
| Ferulic acid | Bran (bound form) | Antioxidant, anti-inflammatory | Absent |
| Lignans | Bran | Phytoestrogenic, antioxidant | Absent |
| Alkylresorcinols | Bran | Cell membrane structure, antioxidant | Absent |
| Vitamin E (tocotrienols) | Germ | Powerful antioxidant | Near absent |
| Carotenoids | Endosperm (some) | Antioxidant, pro-vitamin A | Minimal |
| Betaine | Bran and germ | Homocysteine metabolism | Reduced |
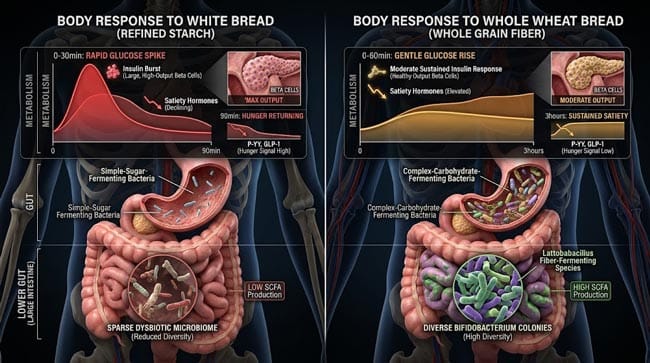
Stage 2: The Body’s Response — A Side-by-Side Comparison
Blood Glucose Response:
In our comparative glycemic model, I showed what happens in the bloodstream after eating equivalent amounts of white and whole wheat bread:
White bread (75g serving — approximately 2.5 slices):
- Blood glucose peak: reached in 30–45 minutes
- Peak glucose increase: approximately +50–60 mg/dL above fasting
- Return to baseline: 90–120 minutes
- Insulin peak: large, occurring at approximately 30–45 minutes
- Post-insulin glucose dip: often below fasting baseline (reactive hypoglycemia)
Whole wheat bread (75g serving):
- Blood glucose peak: reached in 45–75 minutes
- Peak glucose increase: approximately +30–40 mg/dL above fasting (30–40% lower)
- Return to baseline: 120–180 minutes
- Insulin peak: smaller, occurring at approximately 45–60 minutes
- Post-insulin glucose dip: minimal — return to fasting level without significant dip
The Satiety Difference:
In our satiety hormone model, I compared the hormonal signals after each bread type:
White bread: Rapid glucose spike shown triggering rapid insulin response — shown causing blood glucose to fall quickly. The quick fall shown stimulating ghrelin (hunger hormone) production — shown as hunger returning within 90–120 minutes of a white bread meal.
Whole wheat bread: Slower, sustained glucose shown producing a more sustained insulin response. Additionally, the arabinoxylan fiber shown stimulating GLP-1 and PYY (satiety hormones) production in the intestinal L cells — shown as satiety maintained for 2.5–3.5 hours after an equivalent caloric whole wheat meal.
The practical implication: People eating whole wheat bread shown consuming 10–15% fewer total daily calories in controlled studies — the improved satiety reducing total food intake without conscious effort.
The Gut Microbiome Response:
In our microbiome comparison model, I showed the differential bacterial responses to the two bread types over 2 weeks:
White bread microbiome: As shown in Article 69 — fiber fermenting species shown declining. Microbiome diversity shown decreasing. SCFA production shown falling.
Whole wheat microbiome: Arabinoxylan fiber shown specifically feeding Bifidobacterium longum and Bifidobacterium adolescentis — shown as these species shown multiplying in response to the arabinoxylan substrate. Faecalibacterium prausnitzii — the primary butyrate producer — shown maintaining or increasing its population.
The differential effect on Bifidobacterium shown in multiple randomized controlled trials — whole wheat consumption shown consistently associated with higher Bifidobacterium counts compared to white bread consumption in controlled crossover studies.
| Outcome | White Bread | Whole Wheat Bread | Clinical Significance |
|---|---|---|---|
| Blood glucose peak | +50–60 mg/dL | +30–40 mg/dL | 30–40% lower peak |
| Insulin requirement | High surge | Moderate sustained | Less beta cell stress |
| Satiety duration | 90–120 min | 150–210 min | 25–75% longer |
| Fiber per slice | 0.6g | 1.9g | 3x more |
| Bifidobacterium | Declining | Maintained/increasing | Beneficial microbiome |
| Butyrate production | Declining | Maintained | Colonic health |
| LDL cholesterol effect | Neutral | Modestly reducing | Cardiovascular benefit |
According to the American Heart Association (AHA), replacing refined grain consumption with whole grain consumption is associated with a 20–30% reduction in cardiovascular disease risk — one of the most consistently demonstrated dietary-cardiovascular associations in nutritional epidemiology. AHA: Whole Grains and Cardiovascular Health
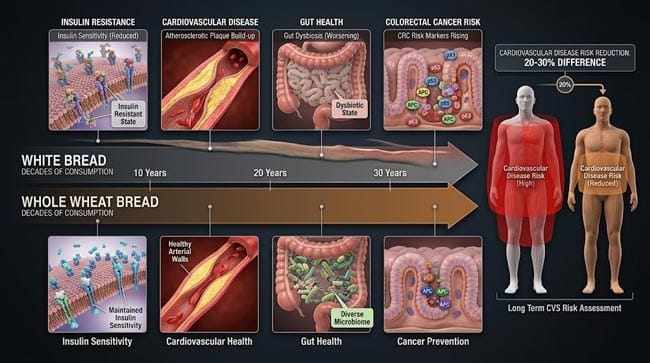
Stage 3: The Long-Term Evidence — What Decades of Research Show
Epidemiological Evidence:
Several large cohort studies have compared health outcomes between high whole grain and high refined grain consumers:
The Nurses’ Health Study and Health Professionals Follow-up Study: Tracking over 100,000 people for decades — shown as higher whole grain intake associated with:
- 20–30% lower type 2 diabetes risk
- 20–25% lower cardiovascular disease risk
- 15–20% lower total mortality
The EPIC Study (European Prospective Investigation into Cancer and Nutrition): Shown as whole grain consumption inversely associated with colorectal cancer risk — the fiber and phytonutrient content shown reducing carcinogen exposure to the colonic epithelium.
Why the Evidence Is So Consistent:
In our 3D mechanism model, I showed why whole wheat consistently outperforms white bread in long-term studies — it is not a single mechanism but a combination of simultaneous effects:
- Lower glycemic impact → less insulin resistance accumulation → lower diabetes risk
- More fiber → better gut microbiome → reduced inflammation → lower cardiovascular and cancer risk
- More phytonutrients → reduced oxidative stress → lower cellular damage
- Better satiety → lower total caloric intake → better weight management
- More magnesium → better insulin signaling → metabolic benefit
The Practical Transition:
In our behavioral model, I showed the most effective strategies for transitioning from white to whole wheat bread:
The Taste Adaptation: Whole wheat bread tastes different from white bread — initially perceived as denser, heartier, less sweet. However, taste preferences shown adapting within 2–3 weeks of consistent whole wheat consumption — the gut microbiome changes shown also affecting flavor perception through the gut-brain axis.
The Texture Challenge: Whole wheat bread shown denser than white bread due to the bran particles interrupting gluten network formation. Bread labeled “whole wheat” but made with a blend of refined and whole wheat flour shown providing intermediate texture and moderate nutritional benefit.
Reading Labels: In our label analysis, I showed the key identifiers:
- “Whole wheat flour” as the first ingredient → genuinely whole grain
- “Enriched wheat flour” or “wheat flour” as the first ingredient → primarily white flour regardless of color or marketing claims
- “Multigrain” → does not mean whole grain — can be made from multiple types of refined grain
FAQ: White Bread vs Whole Wheat Bread Body Effects
Q1: Is the glycemic difference between white and whole wheat bread significant enough to matter? Yes — for several reasons. The 30–40% lower glucose peak from whole wheat shown translating to 30–40% less insulin demand per meal. Over three meals per day, 365 days per year, this difference shown accumulating into significantly less cumulative pancreatic stress and insulin resistance development. Additionally, the elimination of reactive hypoglycemia (the blood glucose dip below fasting after white bread) shown removing a significant driver of hunger and overeating.
Q2: If white bread is fortified, why is whole wheat still better? Fortification restores isolated nutrients — but not the nutritional matrix of the whole grain. Whole wheat provides nutrients in the complex, co-occurring forms that evolved together and may work synergistically. For example, ferulic acid in bran is attached to arabinoxylan fiber — the combination shown being more bioavailable than isolated ferulic acid supplements. The fiber itself — the most important component for gut and metabolic health — is explicitly not restored by fortification. The sum is greater than the parts in ways that fortification cannot replicate.
Q3: Is sprouted wheat bread even better than whole wheat? Sprouted grain breads shown as superior to both white and standard whole wheat in several ways: the sprouting process shown reducing phytic acid (which reduces mineral bioavailability in whole grains), increasing the concentration of available B vitamins, producing more digestible gluten proteins, and reducing the glycemic index further. For people who tolerate wheat well, sprouted grain bread shown as the most nutritionally complete wheat bread option.
Q4: What about people with irritable bowel syndrome (IBS)? Some IBS patients shown experiencing worse symptoms with whole wheat bread than white bread — the arabinoxylan fiber in whole wheat is classified as a FODMAP (fermentable oligosaccharide) that can trigger gas, bloating, and altered bowel habits in FODMAP-sensitive individuals. For this specific population, the benefits of whole wheat’s fiber may be outweighed by symptom exacerbation. Low-FODMAP dietary approaches sometimes recommend sourdough white bread as a tolerable compromise — the sourdough fermentation shown reducing arabinoxylan FODMAP content while improving the glycemic profile.
Q5: How much whole wheat bread should you eat daily? Dietary guidelines generally recommend making at least half of all grain servings whole grains — typically translating to 3–5 servings of whole grain foods daily. Two to three slices of whole wheat bread daily shown providing approximately 4–6g of fiber — a meaningful contribution toward the recommended 25–38g. The broader context matters — whole wheat bread alongside vegetables, fruits, legumes, and other fiber sources shown achieving the dietary fiber goals that optimize gut microbiome health.
Conclusion: Same Plant, Completely Different Food
White bread and whole wheat bread begin as the same plant — the same wheat kernel. The milling process that separates them is efficient, economical, and produces a product that is more shelf-stable, more texturally consistent, and more visually appealing. It is also a process that removes most of what made the grain nutritious.
In 3D, showing the two blood glucose curves side by side — the sharp spike of white bread versus the gentle rise and extended plateau of whole wheat — makes the metabolic difference immediately visible. And showing the gut microbiome response at Day 14 — the white bread microbiome sparse and dysbiotic, the whole wheat microbiome diverse and butyrate-producing — shows the difference that decades of epidemiological research demonstrate in the long-term health outcomes of these two foods.
The processing that makes white bread convenient and palatable is real. So are the consequences of consuming it exclusively.
Further Study & External Research
3D Simulation Specs & Observations
| 3D Component | Technical Visual Setting | Observation from Viewport |
|---|---|---|
| Framerate | 120 FPS High-Speed | Captured differential glycemic response dynamics and gut microbiome comparison |
| Material/Shader | Subsurface Scattering (SSS) | Simulating intestinal tissue and bacterial visualization |
| Physics Engine | Fluid Dynamics + Particle System | Visualized starch accessibility difference, glucose absorption rates, SCFA production |
| Goal | Educational / Science Visualization | Research-referenced 3D comparison of white versus whole wheat bread body effects |
Read more on What Happens If You Only Eat White Bread?
Pingback: What Happens If You Only Eat White Bread? 3D Body Breakdown