
The Creator’s Note & Disclaimer: As a 3D artist at WhatIfBody3D, I rendered this scenario at 120 FPS. Our models explore what happens if you only eat white bread — visualizing refined starch glycemic mechanics, progressive nutritional deficiency development, gut microbiome disruption from fiber absence, and the multi-system consequences of a white bread exclusive diet. This visualization is part of our “What If” series and is for educational and informational purposes only, as stated in our About Page.
Quick Answer: What Happens If You Only Eat White Bread? (The Atomic Answer)
What happens if you only eat white bread? The paradox of white bread is identical to the potato paradox — you can feel full while your body is being systematically starved of the nutrients it needs to function.
- The Calorie Illusion: White bread provides adequate calories (approximately 265 kcal per 100g) — meaning you will not feel hungry. But it is almost completely stripped of the fiber, vitamins, minerals, protein quality, and phytonutrients that make food nourishing rather than merely filling.
- The Blood Sugar Crisis: White bread has a glycemic index (GI) of 70–75 — similar to table sugar. Each slice shown producing a rapid blood glucose spike followed by a crash — repeated multiple times daily creating a continuous cycle of insulin surges and energy crashes.
- The Fiber Famine: White bread contains approximately 0.6g of fiber per slice compared to 1.9g in whole wheat. On a white bread exclusive diet, fiber intake approaches zero — shown producing gut microbiome collapse within days and constipation within hours.
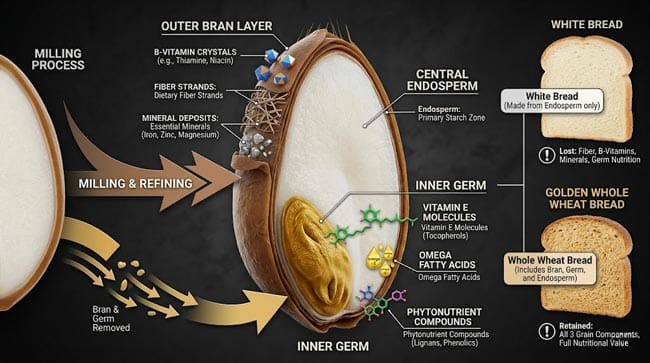
- The Nutritional Void: The milling process that produces white flour removes the bran (fiber, B vitamins, minerals) and germ (vitamin E, healthy fats, phytonutrients) — leaving only the endosperm (starch and some protein). Even with mandatory fortification, white bread is a nutritionally impoverished food when consumed exclusively.
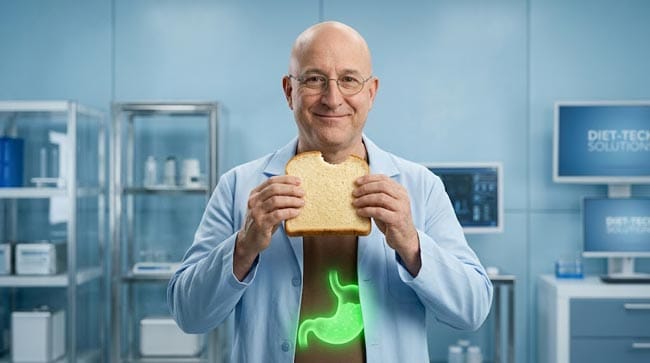
My 3D Discovery: Rendering the “Empty Full” Paradox
When I was building the nutritional deficiency model for this simulation, the most powerful visual was the contrast between cellular energy status and cellular nutritional status on a white bread exclusive diet.
In the 3D cellular model, energy status — represented by ATP production — shown as relatively normal on white bread. The starch is digested to glucose, glucose enters the glycolytic pathway, ATP is produced. The cells shown working. The person feels functional.
But simultaneously, shown as: vitamin B12 stores depleting (white bread contains none), iron levels shown declining (white bread provides minimal bioavailable iron), vitamin C shown approaching zero (white bread contains none), protein synthesis shown becoming limited (white bread protein is low quality and quantity). The cells shown having energy but lacking the raw materials for maintenance, repair, and immune function.
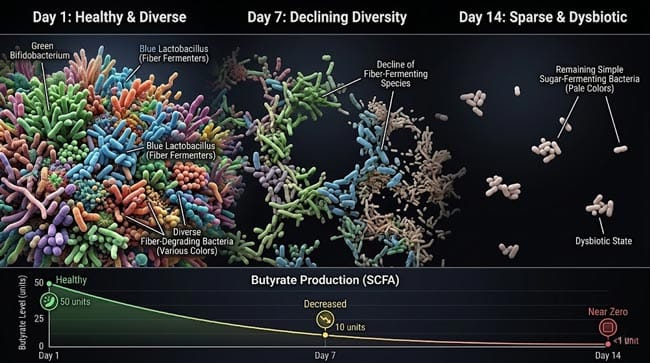
3D Observation: The most visually striking sequence in this simulation is the gut microbiome collapse over 14 days of white bread exclusive diet. In a normal microbiome, hundreds of bacterial species shown in a colorful, diverse ecosystem — different species occupying different niches, producing short-chain fatty acids, vitamins, and immune-modulating compounds. On Day 3 of the white bread diet, fiber-fermenting species shown beginning to decline — their food source disappearing. By Day 7, shown as a dramatically simplified microbiome — primarily simple sugar-metabolizing bacteria remaining. By Day 14, shown as a sparse, dysbiotic community that fails to produce adequate butyrate for colonic cell health.
Stage 1: What White Bread Actually Is — The Milling Story
The Three Parts of a Wheat Grain:
Understanding white bread requires understanding what is removed during milling. In our 3D wheat grain model, I rendered the complete anatomy of a wheat kernel:
The Bran (outer layer — 13–17% of grain weight) Shown as the multi-layered outer coating of the grain — composed primarily of insoluble fiber (arabinoxylan, cellulose) with concentrated deposits of:
- B vitamins (B1/thiamine, B2/riboflavin, B3/niacin, B5/pantothenic acid, B6, folate)
- Minerals (iron, zinc, magnesium, phosphorus, selenium)
- Phytic acid (reduces mineral bioavailability — also removed with bran)
- Lignans (phytoestrogens with antioxidant properties)
The Germ (embryo — 2–3% of grain weight) Shown as the living embryo of the wheat seed — the most nutrient-dense portion:
- Vitamin E — the primary fat-soluble antioxidant
- Healthy fats — including omega-6 and some omega-3 fatty acids
- B vitamins — concentrated stores
- Phytosterols — plant sterols that reduce cholesterol absorption
- Antioxidant compounds — carotenoids, flavonoids
The Endosperm (starchy interior — 83–85% of grain weight) Shown as the largest portion — primarily starch with some protein (gluten-forming proteins: glutenin and gliadin):
- Starch — approximately 72% by weight
- Protein — approximately 10–13% by weight (but incomplete amino acid profile)
- Minimal vitamins and minerals — relative to bran and germ
What White Flour Retains: White flour is produced by milling wheat and removing the bran and germ — retaining only the endosperm. The result shown as losing approximately:
- 75% of the fiber
- 50–80% of the B vitamins
- 60–70% of the minerals
- Nearly 100% of the vitamin E
- Nearly 100% of the healthy fats
- All phytonutrients
Mandatory Fortification:
In many countries, white flour is required to be fortified with some of the removed nutrients — typically iron, thiamine, niacin, riboflavin, and folic acid. In our 3D model, I showed what fortification restores versus what remains absent:
| Nutrient | Whole Wheat | White Bread (Fortified) | Restoration Status |
|---|---|---|---|
| Fiber | 6.7g/100g | 2.7g/100g | ❌ 60% lost — not restored |
| Magnesium | 137mg/100g | 25mg/100g | ❌ 82% lost — not restored |
| Zinc | 2.65mg/100g | 0.62mg/100g | ❌ 77% lost — not restored |
| Vitamin E | 1.01mg/100g | 0.06mg/100g | ❌ 94% lost — not restored |
| Iron | 3.19mg/100g | 3.6mg/100g | ✅ Restored by fortification |
| Thiamine (B1) | 0.41mg/100g | 0.36mg/100g | ✅ Mostly restored |
| Folate | 44mcg/100g | 29mcg/100g | ⚠️ Partially restored |
| Phytonutrients | 100% | ~5% | ❌ Mostly lost — not restored |
According to the Harvard T.H. Chan School of Public Health, the refining process that creates white flour removes the most nutritionally valuable components of wheat — and while fortification restores some nutrients, it cannot replicate the complex nutritional matrix of the whole grain. Harvard: The Nutrition Source — Whole Grains
Stage 2: The 30-Day White Bread Diet — System by System Breakdown
The Blood Sugar System — Continuous Crisis:
White bread’s high glycemic index (GI ~75) shown producing a characteristic blood glucose pattern when consumed exclusively:
Post-meal spike: Shown as rapid starch digestion — white flour’s finely milled, highly processed starch shown being accessible to amylase enzymes within minutes. Blood glucose shown rising rapidly — peaking within 30–45 minutes of consumption.
Insulin surge: Pancreatic beta cells shown responding with proportional insulin release — shown as a large insulin pulse to handle the incoming glucose. This is quantitatively similar to drinking a sugary beverage.
Post-insulin crash: The insulin response shown overshooting — blood glucose shown falling below baseline within 90–120 minutes. The resulting hypoglycemic dip shown producing: fatigue, difficulty concentrating, irritability, and hunger — the classic “sugar crash.”
The continuous cycle: On a white bread exclusive diet, this cycle shown repeating 3–5 times daily — each meal producing the same spike-crash pattern. Over 30 days, shown producing:
- Progressive insulin resistance (cells shown becoming less responsive to insulin)
- Beta cell stress (shown from sustained maximum output demand)
- Chronic low-grade inflammation (shown from repeated glycemic excursions)
- Risk markers for type 2 diabetes shown increasing measurably
The Gut Microbiome — Collapse Without Fiber:
The gut microbiome’s primary substrate is dietary fiber — specifically the complex polysaccharides (arabinoxylan, inulin, pectin, resistant starch) that human digestive enzymes cannot break down and that colonic bacteria ferment to produce short-chain fatty acids (SCFAs).
White bread provides approximately 0.6g of fiber per slice — on a white bread exclusive diet, total fiber intake approaches 2–3g per day versus the recommended 25–38g.
In our 3D microbiome time-lapse:
Day 1–3: Fiber-fermenting species (Bifidobacterium, Lactobacillus, Faecalibacterium prausnitzii) shown beginning to decline — their food source shown disappearing.
Day 4–7: Dramatic reduction in microbiome diversity shown — the rich, complex ecosystem shown simplifying rapidly. SCFA production shown declining — particularly butyrate, which shown as the primary energy source for colonocytes (colon cells).
Day 8–14: Severely dysbiotic microbiome shown — simple sugar fermenting bacteria shown dominating. Colonic epithelium shown showing signs of stress from butyrate deprivation. Gut barrier integrity shown beginning to compromise.
Day 14–30: Persistently dysbiotic state — associated with increased intestinal permeability (shown as “leaky gut”), increased inflammatory markers, and reduced immune function.
The Nutritional Deficiency Timeline:
| Nutrient | White Bread Content | Days to Deficiency | First Symptoms |
|---|---|---|---|
| Fiber | 2–3g/day (vs 25–38g needed) | Immediate | Constipation within 24–48 hours |
| Vitamin C | 0mg | 4–6 weeks | Fatigue, reduced wound healing |
| Magnesium | Very low | 4–8 weeks | Muscle cramps, fatigue, irregular heartbeat |
| Zinc | Very low | 4–8 weeks | Immune impairment, slow wound healing |
| Vitamin E | Near zero | 4–8 weeks | Neurological symptoms (with severe deficiency) |
| Essential fatty acids | Near zero | 4–6 weeks | Dry skin, poor wound healing, inflammation |
| Protein quality | Incomplete | Weeks to months | Muscle wasting begins |

Stage 3: The Constipation Cascade — What Happens Without Fiber
Why Fiber Is Essential for Bowel Function:
Dietary fiber serves multiple mechanical and biological functions in the colon that white bread fails to provide:
Mechanical functions (insoluble fiber):
- Stool bulking — shown as insoluble fiber absorbing water and creating the physical mass that stimulates colonic motility
- Transit time acceleration — shown as the larger, softer stool shown moving more quickly through the colon
- Reduced colonic pressure — shown as adequate stool bulk shown reducing the straining pressure that contributes to hemorrhoid and diverticulitis development
Biological functions (soluble fiber):
- Prebiotic substrate — shown as fermentable fiber feeding beneficial bacteria
- SCFA production — butyrate shown nourishing colonocytes, propionate shown affecting liver metabolism, acetate shown providing systemic energy
- Cholesterol reduction — soluble fiber shown binding bile acids in the intestine — shown reducing cholesterol recycling and lowering LDL cholesterol
What Happens Without Fiber:
On white bread exclusive diet, the colon shown experiencing:
Reduced stool volume: Without fiber bulk, stool shown becoming small, dry, and hard — shown as transit time increasing dramatically as the reduced stool mass fails to stimulate adequate colonic motility.
Increased straining: The passage of small, dry stool shown requiring significantly more straining force — shown increasing intra-abdominal pressure and venous congestion — contributing to hemorrhoid development.
Colonic microbiome starvation: Without fermentable fiber, colonic bacteria shown beginning to ferment the colonic mucus layer instead — shown as the protective mucus layer thinning — compromising the colonic epithelial barrier.
Diverticulosis risk: Chronic high colonic pressure from straining shown associated with the development of diverticula — small outpouchings in the colonic wall shown forming at weak points — a condition affecting over 50% of adults over 60 in Western high-fiber-deficient populations.
FAQ: What Happens If You Only Eat White Bread?
Q1: Is white bread worse for you than sugar? Calorie for calorie, white bread produces a glycemic response nearly identical to table sugar — with a GI of 70–75 compared to sugar’s GI of 65. However, sugar provides zero additional nutrition beyond calories, while white bread provides some protein and (through fortification) some B vitamins and iron. Neither should be a dietary staple, but exclusive white bread consumption causes additional harms beyond the glycemic impact — specifically fiber deficiency and gut microbiome disruption.
Q2: Does toasting white bread make it healthier? Toasting produces a phenomenon called retrogradation — some of the starch shown rearranging into resistant starch form during the drying and cooling process. Resistant starch has a lower glycemic index and acts more like fiber in the colon. Toasting white bread shown reducing its GI by approximately 5–10 points — a modest but real improvement. However, this does not restore the fiber, vitamins, minerals, or phytonutrients removed during milling.
Q3: What about sourdough white bread — is it healthier? Sourdough fermentation shown producing several metabolic benefits: the lactic acid shown reducing the bread’s glycemic index significantly (GI of approximately 53 vs 75 for regular white bread), the fermentation process shown increasing the bioavailability of some minerals by reducing phytic acid, and the organic acids shown affecting starch digestibility. Sourdough white bread shown as substantially more metabolically favorable than regular white bread — though still deficient in fiber and most micronutrients compared to whole wheat.
Q4: Why do people feel fine eating white bread for years if it’s so nutritionally deficient? Most white bread consumers are not eating exclusively white bread — they are eating it alongside other foods that provide the nutrients white bread lacks. A person eating white bread with eggs, vegetables, and meat is getting the missing nutrients from other sources. The exclusive white bread scenario is clinically extreme — but the gradual displacement of nutritious foods by refined carbohydrates in typical Western diets produces the same nutrient gaps more slowly and less dramatically.
Q5: Is gluten in white bread dangerous? For approximately 1% of the population with celiac disease, gluten — the protein complex in wheat — triggers an autoimmune response that damages the small intestinal lining. For another 6–10% with non-celiac gluten sensitivity, gluten consumption produces symptoms without autoimmune damage. For the remaining 90%+, gluten is a completely safe dietary protein. The health concerns about white bread are not primarily about gluten — they are about the refined starch, absent fiber, and stripped micronutrients.
Conclusion: Full but Starving
White bread represents the most efficient way humans have engineered to feel full while receiving minimal nutritional value — a technically remarkable achievement in food processing that removes the nutritional value of wheat while preserving its caloric and textural appeal.
In 3D, watching the gut microbiome collapse over 14 days without fiber — the colorful, diverse ecosystem shown simplifying to a sparse, dysbiotic shadow of itself — is the most powerful visualization of what white bread exclusive consumption actually does. The blood glucose spikes are dramatic. The nutritional deficiencies are significant. But the microbiome collapse shown as the most immediately profound effect — occurring faster than any other consequence and producing systemic effects from the gut outward.
Being full does not mean being nourished. White bread proves this more clearly than almost any other single food.
Further Study & External Research
3D Simulation Specs & Observations
| 3D Component | Technical Visual Setting | Observation from Viewport |
|---|---|---|
| Framerate | 120 FPS High-Speed | Captured glycemic spike dynamics and gut microbiome collapse time-lapse |
| Material/Shader | Subsurface Scattering (SSS) | Simulating colonic tissue and bacterial colony visualization |
| Physics Engine | Volumetric Particle System + Fluid Dynamics | Visualized blood glucose waves, insulin response, microbiome diversity decline |
| Goal | Educational / Science Visualization | Research-referenced 3D breakdown of white bread exclusive diet consequences |
Read more on White Bread vs Whole Wheat Bread
Pingback: White Bread vs Whole Wheat Bread Body Effects: 3D Science