
The Creator’s Note & Disclaimer: As a 3D artist at WhatIfBody3D, I rendered this scenario at 120 FPS. Our models explore what happens if you drink only cola and no water — visualizing phosphoric acid’s cellular effects, high fructose corn syrup metabolism, osmotic dehydration mechanics, and the progressive organ consequences of replacing water with cola. This visualization is part of our “What If” series and is for educational and informational purposes only, as stated in our About Page.
Quick Answer: What Happens If You Drink Only Cola? (The Atomic Answer)
What happens if you drink only cola and no water? Cola is not hydration — it is dehydration in disguise. Every can contains compounds that actively pull water out of your cells while providing no net hydration benefit.
- The Osmotic Trap: Cola contains approximately 39g of sugar per 355ml can — creating a high-osmolality fluid that draws water out of intestinal cells into the gut lumen through osmosis, reducing net water absorption.
- The Phosphoric Acid Problem: Cola’s characteristic tang comes from phosphoric acid (H₃PO₄) — which binds to calcium in the bloodstream, reducing calcium availability for bones and triggering the kidneys to excrete calcium in urine.
- The Caffeine Diuretic: Like Red Bull, cola contains caffeine (approximately 34mg per 355ml) — producing a diuretic effect that increases urine output beyond fluid intake at high consumption volumes.
- The Fructose Metabolism: High fructose corn syrup — the primary sweetener in most colas — is metabolized exclusively in the liver through a pathway that produces uric acid, triglycerides, and inflammatory compounds as byproducts.

My 3D Discovery: Rendering the “Osmotic Illusion”
When I was building the intestinal absorption model for this simulation, the most counterintuitive visualization was the osmosis sequence. Most people assume that drinking any liquid adds to hydration. In the 3D viewport, I showed what actually happens when a high-sugar cola solution contacts the intestinal lining.
The intestinal epithelial cells — shown as a continuous layer of columnar cells with water transport proteins — are surrounded on one side by the highly concentrated cola solution and on the other side by the relatively lower-concentration blood and tissue fluid. Osmosis moves water toward the higher concentration — which means water moves from the intestinal cells into the cola solution, not from the cola into the cells.
3D Observation: The most visually striking moment is watching this osmotic water movement. Instead of water shown flowing from the gut into the bloodstream as it does with plain water, the water shown flowing in the reverse direction — from blood vessels and intestinal cells into the high-sugar cola solution. The intestinal cells shown visibly shrinking as water leaves them. The net effect: drinking cola actually draws water out of your body’s tissues to dilute the sugar, before any cola fluid can be absorbed. The body must use its own cellular water reserves to process the incoming sugar load.
Stage 1: What Cola Actually Contains — The Chemistry of Dehydration
Cola’s unique combination of ingredients creates a perfect storm for cellular dehydration — each component contributing through a different mechanism.
Full Cola Ingredient Analysis (355ml / 12 fl oz standard can):
| Ingredient | Amount | Mechanism | Dehydration Effect |
|---|---|---|---|
| Water | ~330ml | Base fluid | Partially offset by other ingredients |
| High fructose corn syrup | 39g | Osmotic load, liver metabolism | Draws cellular water into gut |
| Phosphoric acid | ~50mg | Calcium binding, kidney excretion | Increases calcium loss in urine |
| Caffeine | 34mg | Adenosine blockade, diuresis | Increases urine output |
| Caramel color | ~1g | Digestive processing | Minor metabolic load |
| Carbon dioxide | ~6g | Gastric distension | Promotes gastric emptying — faster sugar absorption |
| Sodium | ~45mg | Electrolyte | Insufficient to replace sweat losses |
| Calories | 140 kcal | Energy | 10+ cans needed for daily caloric needs |
The Net Hydration Calculation:
For a single 355ml can of cola:
- Water provided: ~330ml
- Water drawn out by osmosis (sugar): approximately 40–60ml
- Water lost through caffeine diuresis: approximately 30–50ml
- Net hydration contribution: approximately 220–260ml — compared to 300+ml for equivalent plain water
This means cola provides approximately 20–30% less net hydration than the same volume of water — and this deficit compounds dramatically with volume. Replacing all water intake with cola creates a progressive hydration deficit that accelerates with each additional can.
According to the European Journal of Clinical Nutrition, beverages containing greater than 6% sugar concentration produce an osmotic load sufficient to impair net intestinal water absorption — with cola’s approximately 11% sugar concentration placing it well above this threshold. EJCN: Beverage Hydration Index
Stage 2: The Phosphoric Acid Effect — What Cola Does to Your Calcium
This is the most unique and scientifically significant difference between cola and Red Bull — phosphoric acid’s systematic effect on calcium metabolism. No other common beverage contains this compound at the concentrations found in cola.
What is Phosphoric Acid?
Phosphoric acid (H₃PO₄) is added to cola for its sharp, tangy flavor that balances the extreme sweetness of 39g of sugar. Without it, cola would taste cloyingly sweet with no complexity. Phosphoric acid gives cola its characteristic bite.
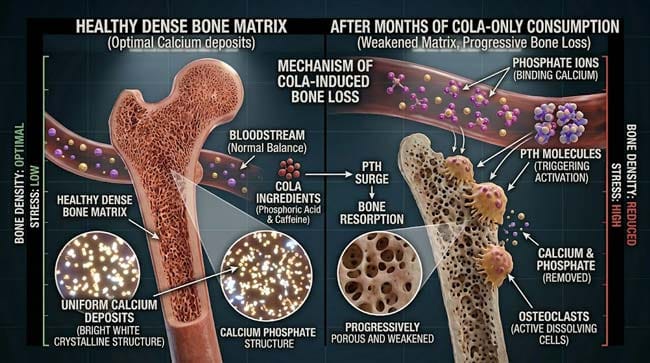
In our 3D molecular model, I rendered phosphoric acid as triangular molecules — each capable of binding to calcium ions in the bloodstream.
The Calcium Binding Cascade:
Step 1 — Absorption Phosphoric acid is absorbed from the intestine into the bloodstream within 30–60 minutes of cola consumption. In the simulation, phosphate ions shown crossing the intestinal wall and entering the portal blood.
Step 2 — Calcium Binding In the bloodstream, phosphate ions shown binding to calcium ions — forming calcium phosphate complexes. This binding reduces the concentration of free ionic calcium in the blood.
Step 3 — Parathyroid Response The parathyroid glands — shown as four small glands on the posterior thyroid — detect the reduced free calcium and respond by secreting Parathyroid Hormone (PTH).
Step 4 — Bone Calcium Mobilization PTH shown activating osteoclast cells in bone — shown as large cells attaching to bone surface and releasing enzymes that dissolve bone matrix, releasing calcium back into the blood.
Step 5 — Kidney Calcium Excretion PTH simultaneously shown increasing kidney calcium excretion in urine — paradoxically increasing calcium loss even as it mobilizes bone calcium.
In the long-term simulation, this cycle — cola consumed, phosphate binds calcium, PTH triggered, bone calcium mobilized and excreted — shown repeating with each can consumed, progressively reducing bone calcium density over months and years.
| Calcium Metabolism Stage | Normal State | Cola-Only State | 3D Visualization |
|---|---|---|---|
| Blood calcium | 8.5–10.5 mg/dL | Transiently reduced | Calcium ions bound by phosphate |
| PTH level | Normal baseline | Elevated after each can | Parathyroid glands shown hyperactive |
| Osteoclast activity | Normal bone turnover | Increased | Bone surface erosion shown accelerating |
| Urinary calcium | Normal excretion | Increased | Kidney calcium excretion shown elevated |
| Bone density | Normal | Progressively declining | Bone matrix shown becoming increasingly porous |
According to the American Journal of Clinical Nutrition, women who consume cola daily have significantly lower bone mineral density than non-cola drinkers — an effect specifically associated with phosphoric acid content rather than caffeine or sugar, as non-cola carbonated beverages do not show the same association. AJCN: Cola Consumption and Bone Mineral Density
Stage 3: The Fructose Metabolism Problem — What Your Liver Does With Cola Sugar
The third unique mechanism by which cola harms the body — beyond osmotic dehydration and phosphoric acid calcium depletion — is the specific metabolic pathway of high fructose corn syrup (HFCS).
Why Fructose is Different From Glucose:
Regular sugar (sucrose) and glucose are metabolized throughout the body — virtually every cell can process glucose for energy. Fructose, however, is metabolized almost exclusively in the liver — creating a unique metabolic bottleneck that has no parallel with other common dietary sugars.
In our 3D hepatic metabolism model, I rendered the fructose pathway in the liver:
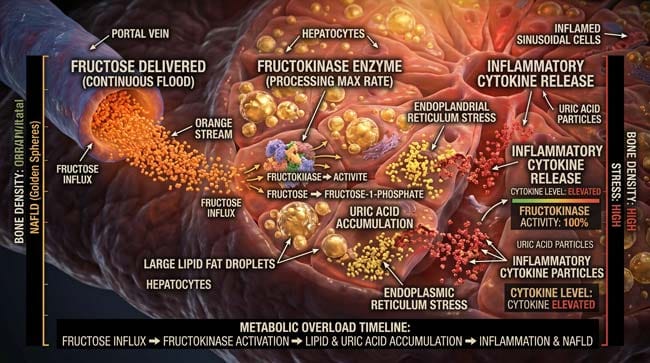
Fructose Entry Fructose absorbed from intestine shown traveling through the portal vein directly to the liver. Unlike glucose, which distributes throughout the body, fructose shown being captured almost entirely by liver hepatocytes.
Fructokinase Metabolism Fructose shown being phosphorylated by fructokinase — an enzyme that, unlike glucokinase (the glucose-processing equivalent), has no feedback regulation. This means fructose is processed as fast as it arrives — with no mechanism to slow down when the liver is overwhelmed.
The Byproduct Cascade:
When the liver processes large fructose loads rapidly, three problematic byproducts are produced simultaneously:
1. Uric Acid The fructokinase reaction consumes ATP and produces uric acid as a byproduct — shown as yellow particles accumulating in liver cells and entering the bloodstream. Elevated uric acid is associated with gout (shown as uric acid crystals in joint spaces) and kidney stone formation.
2. Triglycerides (VLDL) Excess fructose carbon that cannot be used for immediate energy is converted to triglycerides — shown as lipid droplets accumulating inside hepatocytes. With chronic high fructose intake, these droplets shown accumulating progressively — the early stages of non-alcoholic fatty liver disease (NAFLD).
3. Inflammatory Cytokines The metabolic stress of large fructose processing shown triggering inflammatory cytokine production — TNF-α and IL-6 shown as red particles released from stressed hepatocytes into the bloodstream, contributing to systemic inflammation.
The Daily Fructose Load from Cola-Only Diet:
At 10 cans per day (needed to approach caloric needs):
- Total sugar: 390g per day
- Fructose component: approximately 195g per day (HFCS is approximately 55% fructose)
- Daily fructose intake for healthy adults: recommended 25–50g maximum
This represents approximately 4–8 times the recommended maximum fructose intake — shown in the simulation as the liver shown overwhelmed, fat droplets accumulating rapidly, and inflammatory signaling spreading systemically.
According to the American Liver Foundation, chronic excessive fructose consumption is a primary driver of non-alcoholic fatty liver disease — which affects approximately 25% of the global population and is increasingly linked to high sugar beverage consumption. ALF: Fructose and Non-Alcoholic Fatty Liver Disease
FAQ: What Happens If You Drink Only Cola?
Q1: How is cola different from Red Bull in terms of dehydration? Both cola and Red Bull cause dehydration through caffeine’s diuretic effect. However, cola’s dehydration mechanism has two additional components absent from Red Bull: the osmotic effect of higher sugar concentration (39g vs 27g per similar volume) drawing water from intestinal cells, and phosphoric acid creating a calcium-depleting cycle that Red Bull lacks entirely. Cola also contains significantly less caffeine per volume (34mg vs 80mg per can) — meaning cola’s dehydration is driven more by sugar osmolarity and phosphoric acid than caffeine.
Q2: Is diet cola safer to drink exclusively? Diet cola eliminates the fructose metabolism problem and significantly reduces the osmotic dehydration effect — artificial sweeteners do not create the same osmotic load as sugar. However, diet cola still contains phosphoric acid (identical to regular cola) and caffeine, maintaining the calcium depletion and diuretic effects. Diet cola also contains artificial sweeteners whose long-term metabolic effects — particularly on gut microbiome and insulin sensitivity — remain areas of active research. Diet cola is significantly better than regular cola for exclusive consumption, but still not a substitute for water.
Q3: Can drinking cola cause kidney stones? Multiple mechanisms link cola consumption to kidney stone formation. The phosphoric acid increases urinary phosphate and calcium excretion — calcium phosphate stones being one of the most common kidney stone types. The elevated uric acid from fructose metabolism increases the risk of uric acid stones. Additionally, the dehydrating effect of cola reduces urine volume — concentrating all stone-forming compounds. Studies have found regular cola consumption associated with a 23% higher risk of kidney stone formation compared to non-cola drinkers.
Q4: How long would it actually take to become seriously ill on a cola-only diet? Serious symptoms would appear within 48–72 hours — primarily from progressive dehydration and electrolyte imbalance. The phosphoric acid bone effect is a long-term phenomenon (months to years of consistent consumption). Fructose-induced liver changes begin appearing on imaging within weeks of extreme fructose intake. The most immediate threat is the combination of dehydration, caffeine toxicity from high-volume consumption, and electrolyte imbalance — which at extreme cola-only intake would produce symptoms similar to hyperglycemic hyperosmolar state.
Q5: Why does cola make you feel thirsty after drinking it? The osmotic effect of cola’s high sugar content is the primary mechanism. After absorption, the sugar concentration in the blood rises significantly — the hypothalamus detects elevated blood osmolality and triggers the thirst response. Additionally, caffeine-induced diuresis reduces total body water, further triggering thirst. The carbonation may temporarily suppress thirst by producing gastric fullness — but this suppression is short-lived, and the underlying osmotic and diuretic effects continue producing thirst signals.

Conclusion: The Most Convincing Fake Hydration
Cola is the most sophisticated hydration impostor in the modern diet. It looks like water. It feels like a beverage. It temporarily suppresses thirst through gastric distension. But every component — the sugar, the phosphoric acid, the caffeine, the fructose — works against net hydration and metabolic health in distinct, compounding ways.
In 3D, rendering the osmotic water movement sequence — watching water flow backward from intestinal cells into the high-sugar cola solution — makes the mechanism visually immediate. The body is not receiving hydration. It is providing its own cellular water to process the incoming sugar load.
The kidneys receive concentrated blood. The liver receives a fructose flood. The bones receive a phosphate assault. All simultaneously, with every can.
Cola is a remarkable achievement of flavor engineering. As a hydration source, it is uniquely counterproductive.
Further Study & External Research
- EJCN — Beverage Hydration Index
- AJCN — Cola and Bone Mineral Density
- ALF — Fructose and Non-Alcoholic Fatty Liver Disease
3D Simulation Specs & Observations
| 3D Component | Technical Visual Setting | Observation from Viewport |
|---|---|---|
| Framerate | 120 FPS High-Speed | Captured osmotic water movement and phosphoric acid calcium binding |
| Material/Shader | Subsurface Scattering (SSS) | Simulating intestinal epithelial tissue and hepatocyte fat accumulation |
| Physics Engine | Fluid Dynamics + Volumetric Particle System | Visualized osmosis mechanics, calcium binding cascade, fructose metabolism |
| Goal | Educational / Science Visualization | Research-referenced 3D breakdown of cola-only diet physiological effects |
Read more on Cola Effects on Teeth and Bones
Pingback: Cola Effects on Teeth and Bones: The 3D Phosphoric Acid Guide