
The Creator’s Note & Disclaimer: As a 3D artist at WhatIfBody3D, I rendered this scenario at 120 FPS. Our models explore what happens if you drink too much bubble tea — visualizing tapioca pearl digestive mechanics, extreme sugar loading effects, fat accumulation from daily consumption, and the gastrointestinal consequences of excessive boba intake. This visualization is part of our “What If” series and is for educational and informational purposes only, as stated in our About Page.
Quick Answer: What Happens If You Drink Too Much Bubble Tea? (The Atomic Answer)
What happens if you drink too much bubble tea? The answer involves a combination of extreme sugar loading, challenging digestive demands, and caloric excess that most bubble tea drinkers dramatically underestimate.
- The Sugar Bomb: A standard 500ml bubble tea contains 38–54g of sugar — equivalent to eating 9–13 teaspoons of sugar in a single drink. Daily consumption shown producing the same metabolic consequences as chronic soda consumption — insulin spikes, fatty liver risk, and metabolic syndrome development.
- The Calorie Shock: A full bubble tea with pearls, milk, and sugar syrup contains 300–500 calories — equivalent to a full meal. Daily bubble tea drinkers shown unknowingly consuming an additional meal’s worth of calories every day.
- The Pearl Problem: Tapioca pearls are dense, starchy spheres that require significantly more digestive effort than liquid food — spending up to 8 hours in the digestive system compared to minutes for the liquid components.
- The Accumulation Risk: Clinical case reports from multiple countries document bubble tea pearl accumulation causing intestinal obstruction — most commonly in children but documented in adults consuming very large quantities.

My 3D Discovery: Rendering the “Sugar Tsunami”
When I was building the blood glucose model for this simulation, the most visually dramatic sequence was the glycemic response to a full bubble tea consumed quickly. In a normal meal scenario, glucose shown entering the bloodstream gradually as food is digested — the insulin response shown rising smoothly to meet the incoming glucose.
In the bubble tea simulation, the sugar — primarily from the sugar syrup, milk tea base, and brown sugar coating on the pearls — shown absorbing almost entirely within 30–45 minutes because most of it is already in liquid or fine particle form. The blood glucose shown spiking dramatically — the pancreas shown responding with a massive insulin surge to handle the incoming glucose flood.
3D Observation: The most striking visual in this simulation is the pancreatic beta cell response. In a normal meal, beta cells shown releasing insulin in a measured, controlled pattern — a smooth wave of hormone secretion. In the bubble tea scenario, the rapid glucose spike shown driving an emergency insulin response — beta cells shown firing at maximum rate, shown as a dramatic burst of insulin granule release. In people who consume bubble tea daily, this pattern shown repeating every day — beta cells shown working at sustained maximum capacity, contributing to the progressive beta cell exhaustion that precedes type 2 diabetes.
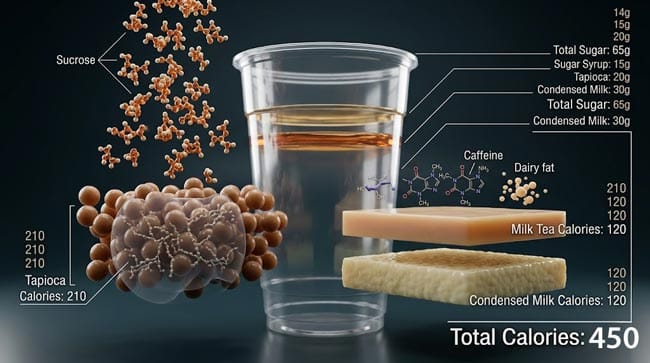
Stage 1: What Bubble Tea Actually Contains — The Nutritional Reality
Full Bubble Tea Analysis (Standard 500ml / 16 fl oz with tapioca pearls):
| Component | Calories | Sugar | Fat | Key Concern |
|---|---|---|---|---|
| Milk tea base | 80–120 kcal | 8–12g | 2–4g | Caffeine + dairy/non-dairy |
| Sugar syrup | 60–100 kcal | 15–25g | 0g | Pure sucrose — fastest absorption |
| Tapioca pearls (standard serving) | 100–150 kcal | 10–15g | 0g | Dense starch + brown sugar coating |
| Condensed milk / creamer | 60–100 kcal | 8–12g | 3–6g | Saturated fat + additional sugar |
| Flavoring syrups | 40–80 kcal | 10–20g | 0g | Additional fructose |
| Total (standard drink) | 340–550 kcal | 51–84g | 5–10g | Exceeds WHO daily sugar recommendation |
The WHO Sugar Recommendation: The World Health Organization recommends limiting free sugars to less than 10% of total energy intake — approximately 25–50g per day for an average adult. A single standard bubble tea contains 51–84g of sugar — shown exceeding the entire daily recommended limit in one drink.
The Fructose Problem:
The sugar in bubble tea comes primarily from sucrose (table sugar) and fructose-based syrups. In our 3D hepatic model, I showed the fructose metabolism pathway — identical to the one shown in the cola article:
- Fructose shown being processed exclusively in the liver through the fructokinase pathway
- At high doses, shown producing triglycerides, uric acid, and inflammatory cytokines as byproducts
- Daily high-fructose bubble tea consumption shown contributing to the same non-alcoholic fatty liver risk as daily soda consumption
The Glycemic Index of Tapioca Pearls:
Tapioca starch has a glycemic index (GI) of approximately 70–75 — classified as high GI. This means the starch shown digesting relatively quickly and causing a significant blood glucose rise — though slower than the liquid sugar components due to the pearl’s density.
In the simulation, the glucose absorption timeline shown as:
- Sugar syrup and dissolved sweeteners: Peak blood glucose rise within 15–30 minutes
- Tapioca pearls: Peak glucose rise within 60–120 minutes — a secondary glucose wave after the initial spike
This two-wave glucose pattern shown producing two separate insulin surges — amplifying the total pancreatic demand from a single drink.
According to the World Health Organization (WHO), free sugar intake above 10% of total daily energy is associated with significantly increased risk of dental caries, obesity, and type 2 diabetes — with each additional sugar-sweetened beverage consumed daily associated with a measurable increase in metabolic syndrome risk. WHO: Sugar Intake Guidelines
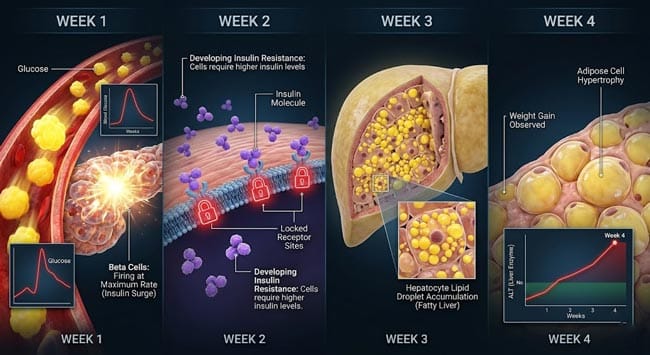
Stage 2: The 30-Day Daily Bubble Tea Timeline — What Happens to Your Body
Week 1 (Days 1–7): The Invisible Damage
Blood glucose dysregulation beginning: Daily sugar loading shown progressively disrupting insulin sensitivity — shown as cells becoming slightly less responsive to insulin signals with each daily spike. By Day 7, shown as fasting blood glucose trending slightly higher than baseline — a subclinical change invisible without blood testing.
Dental enamel attack: The sugar content shown providing substrate for oral bacteria — shown as Streptococcus mutans metabolizing sugars to produce lactic acid. The acidic environment shown beginning to demineralize enamel with each daily consumption — particularly where the straw delivers sugar-rich liquid to specific tooth surfaces.
Caloric surplus accumulating: At 400 average calories per daily bubble tea, shown as an additional 2,800 calories accumulated by end of Week 1 — equivalent to approximately 0.4kg (0.8 lbs) of potential fat gain beyond normal diet.
Week 2 (Days 8–14): The Metabolic Strain
Insulin resistance developing: Shown as cells requiring progressively more insulin to achieve the same glucose uptake effect — shown as pancreatic beta cells producing more insulin per glucose unit to compensate.
Liver fat accumulation beginning: The daily fructose load shown beginning to produce hepatic lipid droplet accumulation — shown as the first signs of non-alcoholic fatty liver steatosis appearing in the 3D hepatocyte model.
Energy crash pattern: The daily sugar spike-crash cycle shown establishing — blood glucose shown rising rapidly after each bubble tea then falling below baseline as the insulin response overshoots — shown producing the familiar afternoon energy crash reported by regular bubble tea consumers.
Week 3–4 (Days 15–30): Measurable Consequences
Weight gain: Daily caloric surplus accumulating as body fat — shown in the adipose tissue model as fat cell hypertrophy progressing. By Day 30, shown as approximately 1.5–2kg of potential fat accumulation from bubble tea calories alone.
Insulin sensitivity measurably reduced: HOMA-IR (a standard measure of insulin resistance) shown increasing significantly by Day 30 — a clinically meaningful change associated with increased type 2 diabetes risk.
Liver enzyme elevation: ALT shown trending upward by Day 30 — indicating hepatocyte stress from daily fructose processing.
Dental caries risk elevated: Enamel demineralization shown progressing — particularly in areas consistently exposed to the sugar-rich liquid.
| Week | Primary Effect | Blood Glucose Pattern | Key Organ Stressed |
|---|---|---|---|
| Week 1 | Caloric surplus, acute glucose spikes | Sharp daily spikes | Pancreas, enamel |
| Week 2 | Insulin resistance beginning, liver fat | Higher baseline, larger spikes | Liver, pancreas |
| Week 3 | Weight gain, measurable metabolic changes | Dysregulated | Liver, adipose tissue |
| Week 4 | Clinical metabolic syndrome markers | Chronically elevated fasting | Multiple organs |
Stage 3: Making Bubble Tea Healthier — The Evidence-Based Modifications
The Modification That Matters Most — Sugar Reduction:
Standard bubble tea is made at 100% sugar — the maximum sweetness level. Most shops offer reduction options that significantly improve the metabolic profile:
| Sugar Level | Sugar Content | Calorie Reduction | Recommendation |
|---|---|---|---|
| 100% (standard) | 51–84g | Baseline | ❌ Exceeds daily recommendation |
| 75% | 38–63g | ~15% less | ❌ Still excessive daily |
| 50% | 26–42g | ~30% less | ⚠️ Borderline acceptable occasionally |
| 25% | 13–21g | ~60% less | ✅ Reasonable occasionally |
| 0% (no sugar) | 3–8g (from milk/pearls) | ~75% less | ✅ Best option |
Pearl Portion Reduction:
Standard pearl servings contain 60–80 pearls — a large starch and calorie load. Requesting half portions or replacing pearls with lower-calorie toppings (grass jelly, aloe vera) shown significantly reducing both caloric and digestive burden.
Frequency Management:
Based on the metabolic data:
- Daily consumption → shown producing measurable metabolic harm within weeks
- 2–3 times per week → shown requiring careful management of other daily sugar sources
- Once per week (treat) → shown producing manageable metabolic impact in otherwise healthy diet
- Occasional (once per month) → shown as negligible metabolic impact

FAQ: What Happens If You Drink Too Much Bubble Tea?
Q1: Is bubble tea worse than soda? Calorie for calorie, bubble tea is typically worse than soda because it combines the high sugar of soda with additional calories from milk, cream, and tapioca pearls — and the tapioca pearls add a high-GI starch load that soda lacks. A standard Coca-Cola contains approximately 140 calories and 39g of sugar per 355ml. A comparable bubble tea contains 340–550 calories and 51–84g of sugar — making it 2–4 times more calorie-dense than soda per serving. The perception that bubble tea is a healthier alternative to soda is not supported by nutritional analysis.
Q2: Can children safely drink bubble tea? Several medical concerns apply specifically to children. The choking risk from tapioca pearls is significant for children under 3–4 years old — pearls shown as a choking hazard comparable to grapes or hot dogs. The sugar content exceeds WHO daily recommendations in a single drink — problematic for developing metabolic systems. The digestive system in children shown less efficient at processing large tapioca pearl loads — contributing to the documented pediatric cases of pearl accumulation and constipation. Most pediatric nutritionists recommend avoiding bubble tea entirely for young children.
Q3: Does the tea component of bubble tea provide any health benefits? The tea base in bubble tea — typically black or green tea — does contain antioxidants (catechins, theaflavins) that have documented health benefits. However, the sugar, milk, and flavoring added to make bubble tea palatable shown largely negating these benefits in several ways: sugar promotes the same oxidative stress that antioxidants combat, the dilution of tea concentration reduces antioxidant load, and the overall caloric burden outweighs any micronutrient benefit. Drinking the tea component without added sugar and pearls would provide the antioxidant benefits — but that would simply be tea, not bubble tea.
Q4: Why do some people feel full after bubble tea but still gain weight? The fullness from bubble tea comes primarily from the physical volume of liquid and the substantial tapioca pearl mass — both produce gastric distension shown triggering satiety signals. However, the liquid sugars and syrup components shown absorbing rapidly and not maintaining satiety as long as equivalent calories from solid food — the fullness fades relatively quickly while the caloric impact remains. Additionally, many people do not reduce their regular food intake to account for bubble tea calories — treating it as a beverage rather than a significant caloric addition to their diet.
Q5: Are the tapioca pearls the most harmful component of bubble tea? The sugar content is actually more metabolically harmful than the pearls in typical consumption. The pearls are primarily starch — digested to glucose — contributing to the glucose spike but not adding fructose load or excessive fat. The sugar syrup, flavoring syrups, and condensed milk components drive the fructose metabolism problems, dental caries risk, and insulin dysregulation more significantly than the pearls themselves. However, the pearls add a digestive challenge and caloric load unique to bubble tea, and in excessive quantities, the pearl accumulation risk described in Article 68 becomes relevant.
Conclusion: The Most Underestimated Daily Calorie Bomb
Bubble tea’s popularity rests partly on the perception that it is a refreshing beverage rather than a high-calorie, high-sugar meal replacement. In 3D, watching the blood glucose spike from a standard bubble tea — the two-wave insulin response to liquid sugar followed by tapioca glucose — alongside the daily hepatic fat accumulation in a 30-day simulation makes the metabolic reality of daily bubble tea consumption immediately visible.
The drink is not inherently harmful. The daily habit is. And like most dietary habits, the dose makes the poison.
Order at 0% sugar, skip the pearls occasionally, and treat it as the dessert it nutritionally resembles — rather than the beverage it is marketed as.
Further Study & External Research
3D Simulation Specs & Observations
| 3D Component | Technical Visual Setting | Observation from Viewport |
|---|---|---|
| Framerate | 120 FPS High-Speed | Captured glycemic spike dynamics and hepatic fat accumulation |
| Material/Shader | Subsurface Scattering (SSS) | Simulating pancreatic beta cell and hepatocyte tissue visualization |
| Physics Engine | Fluid Dynamics + Particle System | Visualized sugar absorption cascade, insulin release, fat droplet accumulation |
| Goal | Educational / Science Visualization | Research-referenced 3D breakdown of daily bubble tea metabolic consequences |
Read more on Bubble Tea Pearls Digestion
Pingback: Bubble Tea Pearls Digestion: The 3D Science of Tapioca